The food service market in the United States is large and actively developing, including more than 1.8 million locations and 18,000 chain companies. The task for the chain restaurant operators is to maintain their brand, know it inside out, and monitor and adapt to many competitive factors. These are the competitive crossover, where the guests eat in another brand restaurant other than their usual, and the competitive substitution, where guests eat when their brand is unavailable. Operators must also recognize consumer trends, including a preference for dates and other occasions or perceived value meals.
In this context, restaurant data scraping can reveal something interesting. Through web scraping, operators can have a bird’s eye view of the performance of roughly 18,000 chains. It can also help them shed light on what consumers think about menu changes and Limited Time Offers (LTOs). In the same regard, restaurant chain data scraping also assists operators in using data obtained from the pricing strategies for better positioning.
Managing this ever-evolving landscape can be challenging, but restaurant data scraping is a vital resource for operators to maintain their edge and provide consumers with bespoke experiences.
Navigating the Competitive Chain Restaurant Landscape
As for the competitive position of chain restaurants within the past year, the results are a little unfavorable as there have been some slight declines in the number of chain units, with the national chains considering having the highest drop of 679 units. Even when considering these last three years’ numbers, the figures present a relatively robust result; however, a much larger picture remains uncovered here.
A few have even performed well above the average regarding unit count expansion. Some innovative ideas from Category Intelligence that are currently gaining popularity include Everytable, which targets selling fresh, healthy food at affordable prices using restaurants, vending machines, and subscription services. Likewise, restaurants with a niche focus, such as Crumbl for cookies and Mochinut for mochi donuts, also enjoy high growth rates.
Overall, store presence in the nation’s ten largest metros has declined by an average of 0.65 % over the last year; however, there has been growth in the specific markets of Atlanta, Chicago, and Phoenix.
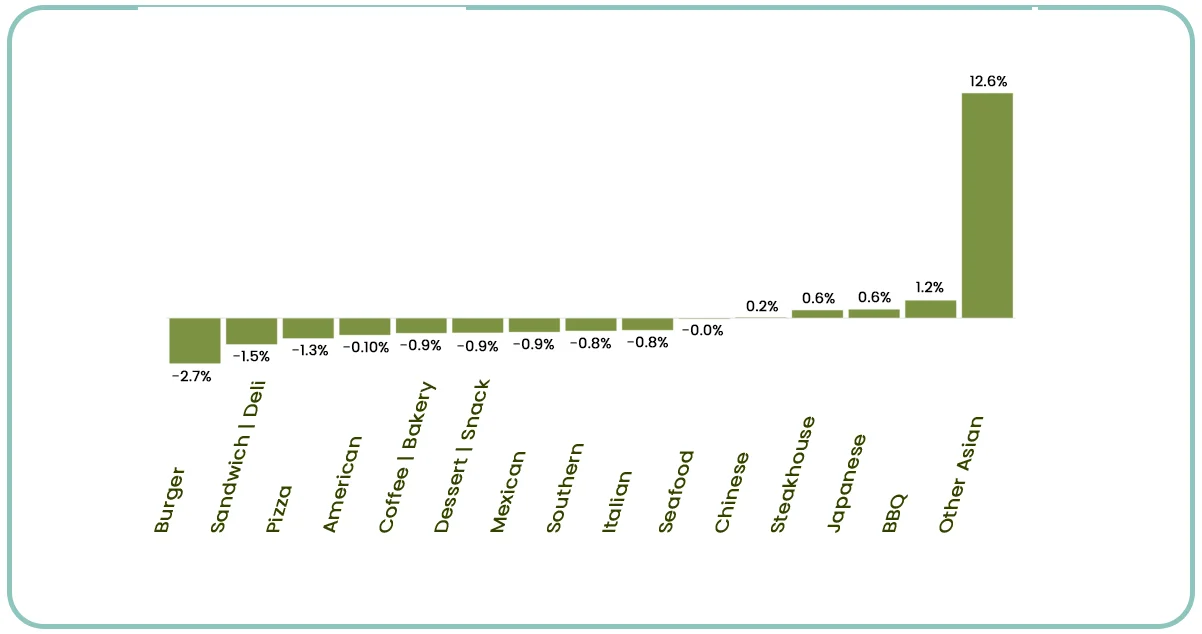
Looking at food delivery data scraping by cuisine type, it is evident that Asian and BBQ types have grown the most in the past year. On the other hand, Burger and Sandwich food delivery chains have shrunk the most in the process. However, this does not necessarily mean that Burger and Sandwich chains are declining; it only shows the effects of competition and substitution in these sectors. Nonetheless, there is a persisting appeal of Burger and Sandwich chains because of the brand loyalty factor.
In such a rapidly evolving environment, chain restaurants can leverage restaurant chain data scraping to remain relevant. Through such tools, operators are in a position to gather information regarding market trends, competitor performance, and customer preferences. This information can be used to guide decisions such as menu diversification, pricing, and market development strategies to help chains overcome challenges and exploit opportunities for growth.
Due to the current pressures in the chain restaurant industry, operators must understand their categories and markets well to succeed. A lack of understanding of these areas means being left behind in the intense competition that the industry is characterized by.
The Role of Menu Innovation and LTOs in Chain Restaurants
Competition is critical to the operation of chain restaurants, and innovation is a vital element in the overall strategy, including LTOs. An analysis of data collected from restaurant data scrapers reveals that 65% of customers visited a restaurant with the intention of ordering an LTO, proving that LTOs are important in increasing sales and traffic.
In the post-pandemic industry, chains are upping LTO innovation, with Applebee's leading the charge, with over doubling LTO promo activity over the last three years. Nonetheless, consumer surveys reveal that 25 percent got their last LTO from a full-service restaurant, Applebee's, proving its popularity.
Even though the pandemic affected the variety of LTOs offered by the national chains, a new trend has been noticed in combo or value meals, comprising 5% of all LTOs. However, restaurant data scraping services proved that today's value meals are not perceived as cheap, as chains raised prices for them despite advertising them as bargains. This shift underscores the fact that chains constantly face the dilemma of how to innovate on the one hand while at the same time meeting consumers' valuation perspective on the other
Navigating Pricing Strategies in the Evolving Chain Restaurant Landscape
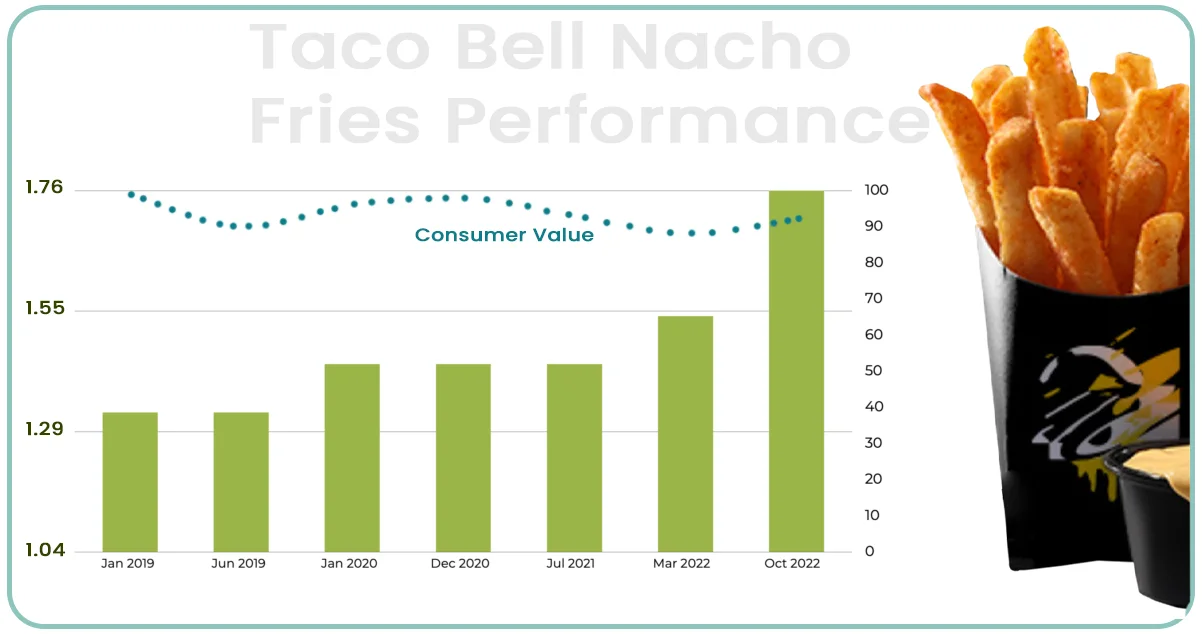
In the current status quo, introducing price hikes is a rather unwise strategy for chain restaurants keen on keeping their value proposition in focus. Nonetheless, there are examples of chains increasing prices without threatening the consumer’s value association. Some examples include Taco Bell’s Nacho Fries, where the company has gradually raised its price over the last few years from $1. From 29 USD in 2019, it increased to $1. It will be 79 in 2022, meaning there is no worsening of customers’ perceived brand value. This success indicates that with proper strategy, changes in price levels are well received in the market.
It is important to note that when setting a pricing strategy in such a competitive and ever-changing market using Mcdonalds Food Delivery App Data Scraping Services, more than simple information such as income per household should be considered. As one might expect, chain menu prices do not vary significantly with median household income; there is no gross or net correlation. Thus, chains must evaluate prices on the individual market level while being informed of the pricing strategies of critical rivals in markets of operation.
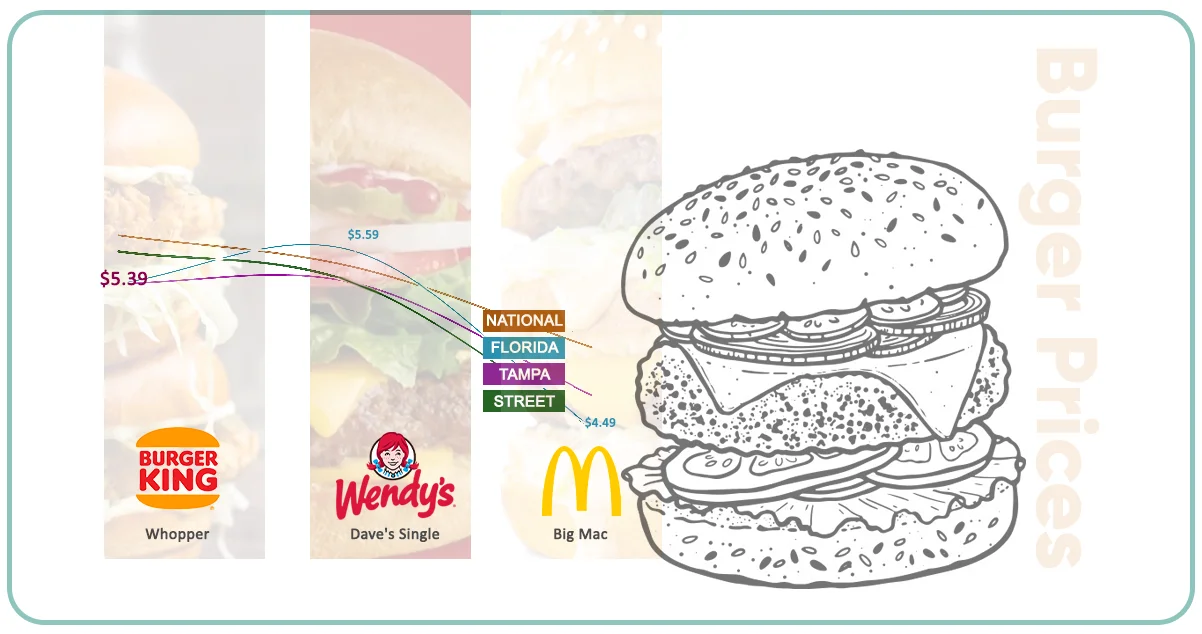
However, individual franchisees can set prices, increasing the variability since the location-level value may not reflect the regional median. For instance, as the chain analysis of Burger has illustrated using Burgerking Food Delivery App Data Scraping Services, while there has been a decrease in annual unit sales over the last year, the prices of comparable burgers in Burger King, McDonald, and Wendy’s differ from one location to another and in some instances, Florida offers lower prices than the average rate. These things must be considered when developing a pricing strategy sensitive to the local customers and competitive in the country.
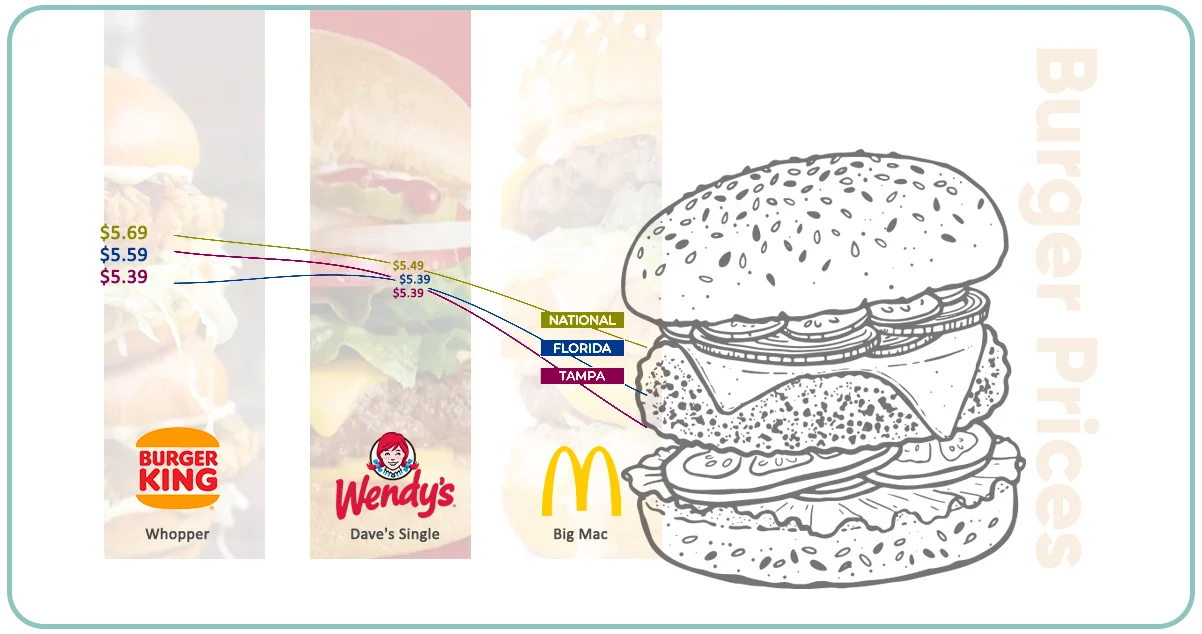
Examining restaurants within less than half a mile using Wendy's Food Delivery App Data Scraping Services, it is possible to observe subtle pricing differences among different chains. For instance, in one location, a Big Mac is priced roughly similar to the median price in Tampa, a Whopper is slightly cheaper than in Tampa, but a Dave’s Single is significantly pricier than the national median. It shows that different chains at the street and regional levels use different price strategies for the same goods. Analysis of these micro-level price.
While it may be informative to analyze one particular item, it is even more important to look at the whole menu to grasp the various pricing tactics employed fully. One uses the regular “basket” to contain dishes from different menu sections (main dishes, side courses, desserts, beverages, etc. ). This basket approach compromises the power of the specific item’s pricing strategy and offers a broader view. Further, evaluating the prices at the basket level makes it easy to compare chains serving different types of foods but for the same dinner time when they are situated closely on the same premise or street.
Today’s chain restaurant market environment and menu pricing change rapidly and frequently. Pricing strategies should be highly documented, and other aspects include category analysis and LTOs. It is necessary to focus not only on competitors in the chain but also on neighbors, following changes in prices for a certain period of time. In such a setting, you need to evaluate your brand's performance against other brands to be able to respond to ever-changing consumer trends.
Conclusion
Are you in need of high-class scraping services? Food Data Scrape should be your first point of call. We are undoubtedly the best in Food Data Aggregator and Grocery Mobile App Scraping, and we render impeccable data analysis for strategic decision-making. With a legacy of excellence as our backbone, we help companies become data-driven, fueling their development. Please take advantage of our tailored solutions that will add value to your business. Contact us today to unlock the value of your data.


